What are Business Intelligence Tools?
Business Intelligence (BI) tools are tools which utilize a set of methodologies and technologies to prepare, present and help analyze data. Through this process, data is turned into actionable business information which helps decision makers and end users to make more effective data-driven decisions.
The set of methodologies and technologies used by business intelligence is widely diverse depending on the purpose of the solution. Some tools focus on the data preparation side of things and may include things like an ETL (Extract, Transform, Load) layer to better organize and utilize data. Some tools focus on wider enterprise use and may focus on data mashup to help businesses make organizational decisions based on information from disparate departmental systems. Some tools focus more on self-service capabilities and end-user experience. And some tools focus on enabling other application’s analytics, these tools are focus on what’s called, “embedded BI” or “embedded analytics” and include a diverse array of additional capabilities which make them easier to integrate into existing systems.
Data Analytics vs. Business Intelligence: What’s the Difference?
The term, “Business Intelligence” has been in popular use since the late 1980s when then Gartner consultant Howard Dresner proposed using it to encompass the then emerging technologies and applications which helped decision makers. Business analytics or data analytics are often used interchangeably with business intelligence, but can also refer to more sophisticated techniques and applications used for statistical modeling and other more advanced types of analysis.
Why Use Business Intelligence?
BI tools are used for a variety of reasons, and when used properly, can have many benefits for a business or individual departments within a business. Some prospective benefits of BI are to drive quicker better decisions, help identify potential areas of operational improvement, help identify different types of trends within businesses or markets, or help create competitive advantages over other competitors whose information is limited. All of these benefits can be realized on both the macro and micro level when properly aligned with business objectives and systems.
Traditionally, BI tools focus on presenting and analyzing historical data from different types of systems stored in SQL databases, data warehouses, as well as other types of relational data sources. With the emergence of Big Data and NoSQL data sources, the amount of data has grown exponentially allowing for more sophisticated analysis to take place.
As the type of data has changed BI over time, so too has the type of BI user changed, with the emergence of self service analytics and ad hoc reporting, the user type of BI has changed and evolved greatly. Previously, the workflow of most BI tools relied on a back and forth between developers, data analysts, and data scientists and the executive staff or decision makers of a company. This back and forth between IT and decision makers created inefficiencies within the decision-making process and led to widespread adoption of self-service technologies which empowered decision makers to make changes and adapt data to fit their needs in real-time allowing for even quicker decisions.
What are the Different Types of Business Intelligence Tools?

Learn More About JReport’s Embedded Analytics Capabilities
As mentioned, BI serves a diverse array of use cases and purposes. As such, the types of tools which have been developed over time have also become specialized to best serve the needs of these different use cases. There’s also a wide variety of analytical and statistical methodologies which have been incorporated into solutions depending on the demands of their users. Here are some of the major tool types used in many modern BI suites: enterprise reporting, dashboards, self-service BI, online analytics processing (OLAP), real-time analysis, cloud BI, embedded BI, open-source BI, predictive analytics, etc.
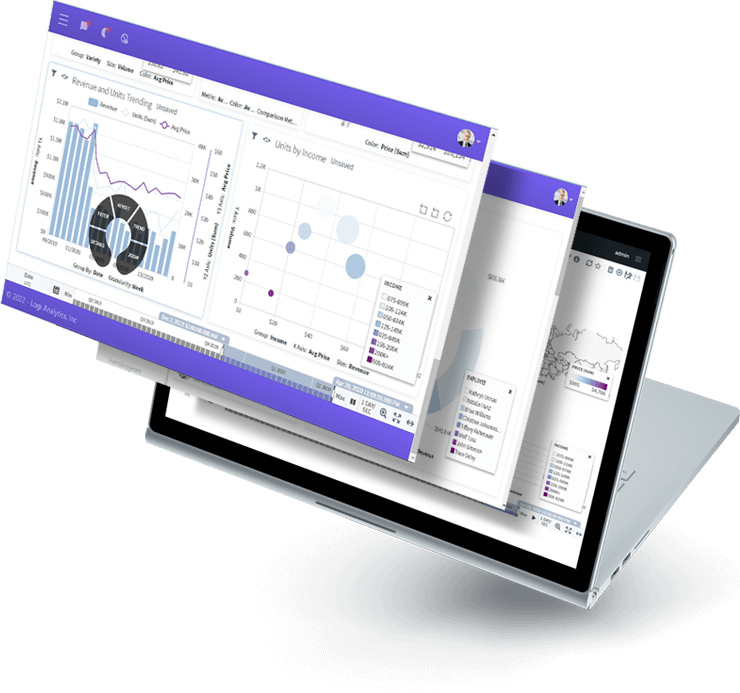
All of these tools are, in one way or another, are data visualization tools—presenting data in a usable way for decision makers. These visualizations may be made up of charts, widgets, tables, key performance indicators (KPIs), or other types of data components.
The level of interactivity found in these component visualizations can vary widely depending on the tool type, but the general trend has continued to focus on increasing interactivity no matter the tool. The main purpose of this is for use in data discovery, which is an important part of the data analysis process.
Some BI platforms now include additional analytical capabilities such as predictive analytics using statistical modeling, full-fledged statistical capabilities, and the ability to leverage big data.
JReport’s Embedded Business Intelligence Tool
JReport’s embedded BI platform comes with everything you would expect from a traditional business intelligence tool. Its main use case is to enable software vendors to embed analytics into their applications enabling their users to analyze large amounts of data to gain further business information for better insight and decision-making.
Belonging to the category of computer software solutions, business intelligence tools include reporting engines and analytics tools capable of easy interpretation of large volumes of data. Using these tools and applications, users can analyze data from their business operations and transform raw data into meaningful, useful and actionable information. Software providers often provide embedded BI to their users as a competitive advantage.
How JReports Business Intelligence Tool Empowers OEM
So why do software vendors use business intelligence tools?
Software vendors use business intelligence tools like JReport for a number of reasons. Embedding an analytics solution instead of building your own can reduce internal BI development giving you more time to focus on your core capabilities. Many companies find this approach more cost effective in the long term. Embedding a business intelligence tool also increases your product’s value with more advanced reporting and dashboarding empowering users and decision makers and ensuring that they make the right decisions at the right time. This gives ISVs a competitive edge when compared to competitors who may only have basic charts available.