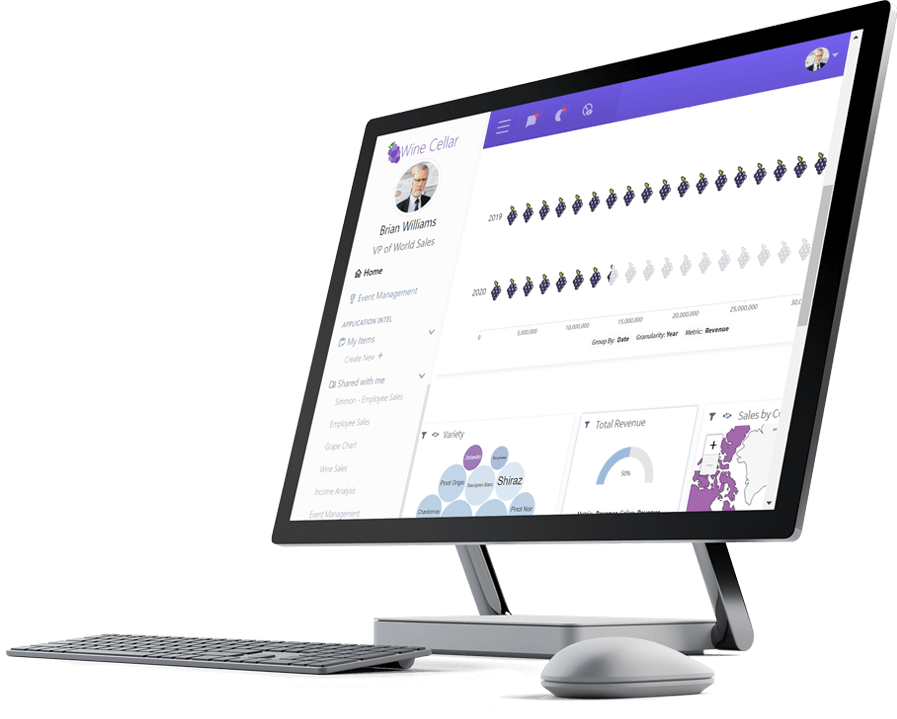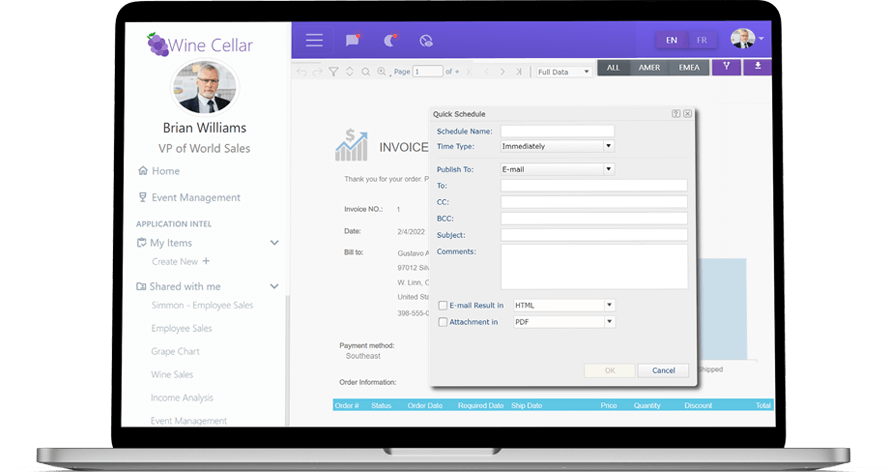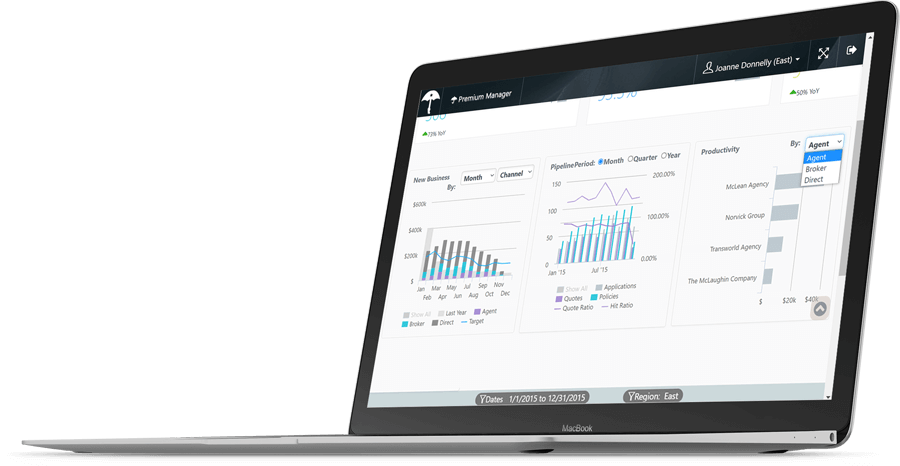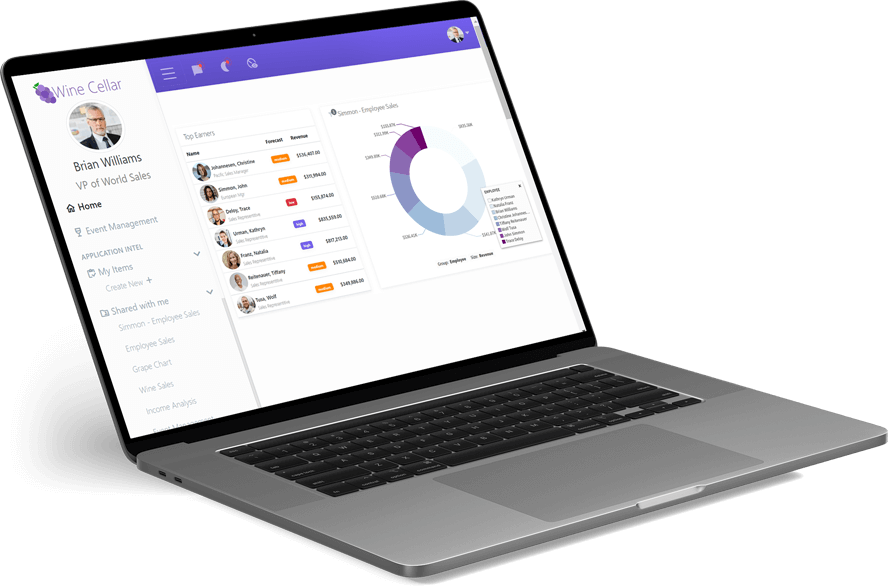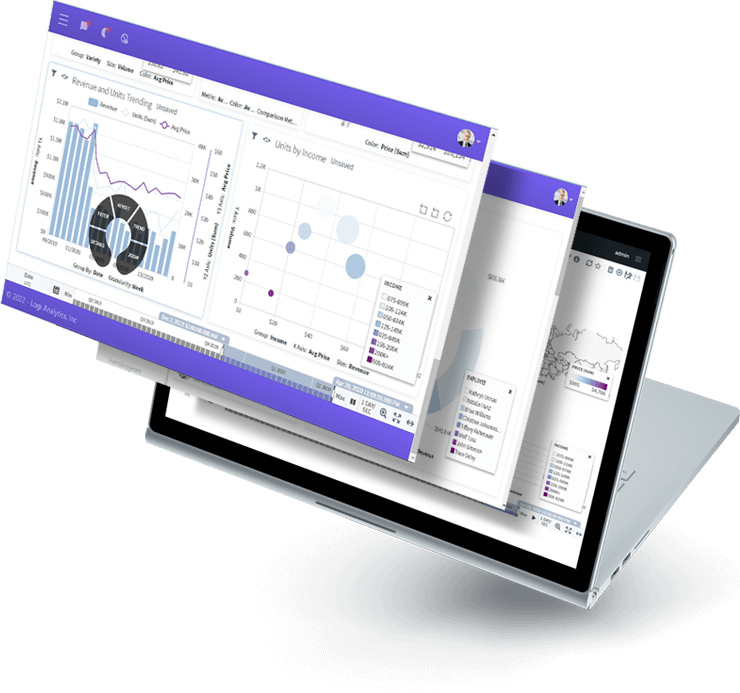
Seamlessly integrate reporting, dashboards and visualizations into any application. Empower your business users to work more efficiently with relevant, in-context information and interactive tools for exploration.
Add Reports, Dashboards, and Visualizations to Your Application
Quickly and securely embed rich charts, reports and dashboards into your software application. Embedded analytics with Logi Report gives you full control over the functionality as well as the look and feel that can be configured to match your application. Let Logi Report do the heavy lifting of analytics while you focus on your application.
Common Embedded Analytics Features
The Difference Between Business Intelligence and Embedded Analytics
Business Intelligence
Business intelligence is a set of tools, methodologies, and processes used to analyze data for use in data discovery and decision support. Some BI technologies include reporting, dashboarding, visualization, data discovery, as well as many others. The main focus of traditional business intelligence is to use aggregated data from multiple systems, usually organization-wide or across several departments. Traditional BI platforms typically present data from separate applications and systems.

Embedded Analytics
The difference between traditional BI and embedded analytics is the context with which the data is being analyzed. Embedded analytics integrates the capabilities found in a BI platform into users’ systems and applications. Simply put, users want to see the data analytics that is pertinent to their daily tasks from within the applications they use. They don’t necessarily need to see a high level view of all the information across the entire business, nor do they want to navigate between your application and a separate tool. They want to explore their data to gain a better understanding of where they can improve efficiency and immediately gain actionable insights.
Embedded Analytics

The difference between traditional BI and embedded analytics is the context with which the data is being analyzed. Embedded analytics integrates the capabilities found in a BI platform into users’ systems and applications. Simply put, users want to see the data analytics that is pertinent to their daily tasks from within the applications they use. They don’t necessarily need to see a high level view of all the information across the entire business, nor do they want to navigate between your application and a separate tool. They want to explore their data to gain a better understanding of where they can improve efficiency and immediately gain actionable insights.
Why Embedded Analytics with Logi Report?

Add Value to Your Application
Give your software application the power of reports, dashboards, and data analysis. Your users will gain valuable insight into their data with the added value of interactive data visualization.

Save Time, Capital, and Effort
Developing a homegrown solution often takes the focus away from your application’s core capabilities. With a low total cost of ownership, Logi Report is robust and customizable giving your users a streamlined experience.

Differentiate from Your Competitors
Many applications only provide basic reporting and a limited library of charts. Providing more advanced, yet easy-to-use analytics in your applications can result in greater value for your end users.

Improve Your Application’s UX
Embedded analytics ensures that anyone can analyze data insights with ease. Enable non-technical end users, analysts, and developers to explore the available data in your application.

Rapid Deployment
Logi Report is easy to integrate. As a result, deployment times are much shorter than deploying and embedding traditional business intelligence tools.

Seamless Integration
Your application will look and feel as if the analytical capabilities were seamlessly built-in.


Enabling SaaS Applications
Logi Report enables you to embed powerful analytics capabilities inside your SaaS applications.

Deploy in the Cloud
Logi Report can be rapidly deployed on private and hybrid cloud environments, or public cloud environments such as Amazon Web Services and Microsoft Azure.

Multi-Tenancy
A multi-tenant architecture enables tenant administrators with fine-grained management of their own resource, security, and user policies ensuring tenants are secured and isolated.
On-Premises Applications
Embed Logi Report into your own software applications or as part of the product offerings you provide to your customers.

Seamless Integration
Logi Report embeds seamlessly into your application by providing the capability to match the look and feel of your application UI in the front end and your business logic in the back end. Your host application can both control and interact with Logi Report. Analytics will work like an integral part of your application.
LEARN MORE

Transparent Interaction
Leverage extensive APIs for full interactive control of reports and dashboards from within your application, removing the boundaries of the embedded analytics. The analytics effectively blend into your application in a seamless way.
Scalability

From small installations to large, multi-tenant environments, Logi Report’s embedded analytics architecture lets your deployment grow as you scale. Our flexible architecture scales to meet peak demand times with node expansion and clustering technologies for load balancing and failover capabilities. Provide highly available, efficient, scalable analytics to your users.
Create Powerful Dashboards & Reports
Build and embed your data visualizations and provide your users with the ability to explore and analyze data in a timely, actionable manner. Dashboards and reports are created by simply dragging and dropping in charts, tables, crosstabs, and other special components from a component library, all with little to no IT involvement.

All-in-One Integrated Platform
A complete BI solution in one package. Logi Report delivers embedded reporting, dashboards and analytics functionality in an all-in-one integrated platform. Choose what features to integrate and how to integrate them through various integration options.
All-in-One Integrated Platform

A complete BI solution in one package. Logi Report delivers embedded reporting, dashboards and analytics functionality in an all-in-one integrated platform. Choose what features to integrate and how to integrate them through various integration options.
Security You Can Trust
Security is the foundation of the Logi Report embedded analytics product suite. Logi Report provides a fully secured system from the metadata all the way up to the final visualization.
Metadata Security Control

Logi Report provides access control to visualizations by applying different security policies, including member, record and column-level security. Member-level security limits user access to the specific members of a dimension. Record and column-level security defines which records and table columns are revealed to any given user.
Built-In or External Security

Logi Report provides a built-in realm management system by default. The security settings and specifications from an external security system, such as LDAP, can be easily imported to integrate with Logi Report’s security system.
Authentication and Single Sign-On

Single sign-on is a must-have for all integrated applications. Logi Report allows developers to create their own rules with the system. Logi Report also seamlessly supports standard single sign-on systems like OAuth tokens to complete the solution. LEARN MORE
Rich APIs

With Logi Report’s advanced API sets, you can connect to data sources, define data models, create visualizations, and more. APIs can be set to automatically handle data source communications, render reports, and export result sets. You can use API calls to manage server resources, administer security, and customize server features. The product UI can also be controlled and can even be tied to what organization a user belongs to. Logi Report supports both Java and JavaScript so you can utilize the API set that best suits your system architecture.
Logi Report Customer Case Studies
MasterControl is a leading global provider of enterprise quality management systems (EQMS) and quality and compliance consulting services. MasterControl needed more advanced analytics and data visualization in their quality management systems to help meet growing customer demands.
MasterControl partnered with Logi Report to update its analytics technology. With Logi Report they’ve been able to empower their quality management system users with more advanced analytics.
Logi Report has changed the game for integrated analytics applications and now customers will be able to more easily and powerfully link all of the data and information associated with our EQMS with information from ERP, CRM and other enterprise systems.”
Matt Lowe, Executive Vice President, MasterControl
RM Education specializes in the use of technology in the UK education market. One of our most popular products is RM Integris which is a cloud-based management information system (MIS) for schools. RM Integris is used by more than 2200 schools and brings together a school’s assessment, attendance, behavior, pupil and staff data into one system. It provides a powerful suite of intuitive tools that enable schools to easily manage their data and then analyze it to identify trends which in turn help to inform school strategies for change and improvement.
RM Integris holds a massive volume of data so they were looking for a tool that had the versatility to combine different data items in a variety of chart and table formats. It needed to be really intuitive and easy to use as school staff don’t have much time to spare. They needed something Java based so they could customize it and they needed simple APIs to utilize and integrate into their product. Some of the information held by schools can be sensitive information, so they also needed 100% reliability.
Using Logi Report meant we could adopt a ready-made package into our product that delivered the flexibility our customers needed and, as such, saved us development time in creating something from scratch.”
Caroline Fisher, Product Manager for RM Integris
The General Services Administration (GSA) is an independent agency of the US Government that helps manage and support departmental functions of US federal agencies. The Federal Acquisition Service (FAS) is one of the agency lines it’s responsible for. The FAS is responsible for providing the most cost-effective and modern solutions to all agencies of the US government.
The GSA/Federal Acquisition Service required an analytics tool that could be easily embedded into an application used to support their daily internal operations. Mainly, the FSA required reporting that could visualize data on the procurement and lifecycle management of government vehicles from managing budgets, to placing orders, to managing vehicle disposal at the end of the vehicle’s life.
Logi Report enabled FAS to deploy a solution “out-of-the-box”, with an very short lead time for implementation which was ideal for the projects needs.
FAS needed a sophisticated reporting tool that could meet the government’s strict security requirements. It also had to be adaptable and provide high performance to all of our different user levels. These factors were in addition to needing a tool that was written in Java, and that was both easy to use and deploy.”
Kevin Payne, Director of Systems Applications, GSA